Have you ever made a chart in excel and wondered how long it takes to make the chart look better in your presentations or reports? In this free bonus e-book, I explain simple techniques to convert a normal excel chart to a professional chart.
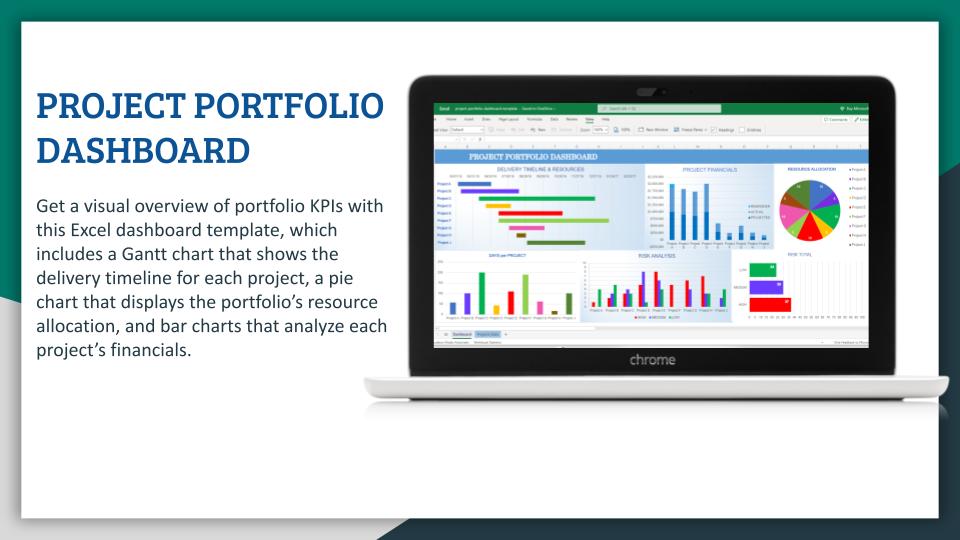
Get a visual overview of portfolio KPIs with this Project Portfolio Dashboard Template, which includes a Gantt chart that shows the delivery timeline for each project, a pie chart that displays the portfolio’s resource allocation, and bar charts that analyze each project’s financials.
The bar charts also include categories for risk analysis and open or pending actions. The project portfolio report section summarizes each project’s schedule, budget, issues, and other details in a spreadsheet format. We have designed these templates keeping the needs of project & program managers, project sponsors & senior executives.
A project manager needs a bird’s-eye view of the project, and the project dashboard offers the ideal perspective, which gives a leader all the pertinent information needed to make the right decisions. The free project management dashboard is a perfect document for collecting all the various aspects of a project so that you can have this necessary insight into its progress.
The project portfolio dashboard can also be used to create specific requests. Focus on one of the many sections of the project and generate a graph from the dashboard for a visually compelling presentation. Hard numbers are fine, but if you’re trying to communicate, it’s best to have an engaging story, and a presentation with visual aids such as the graphs made by your dashboard is more likely to get the point you want across clearly and quickly.
Please contact us if you need to add more features to this template.
