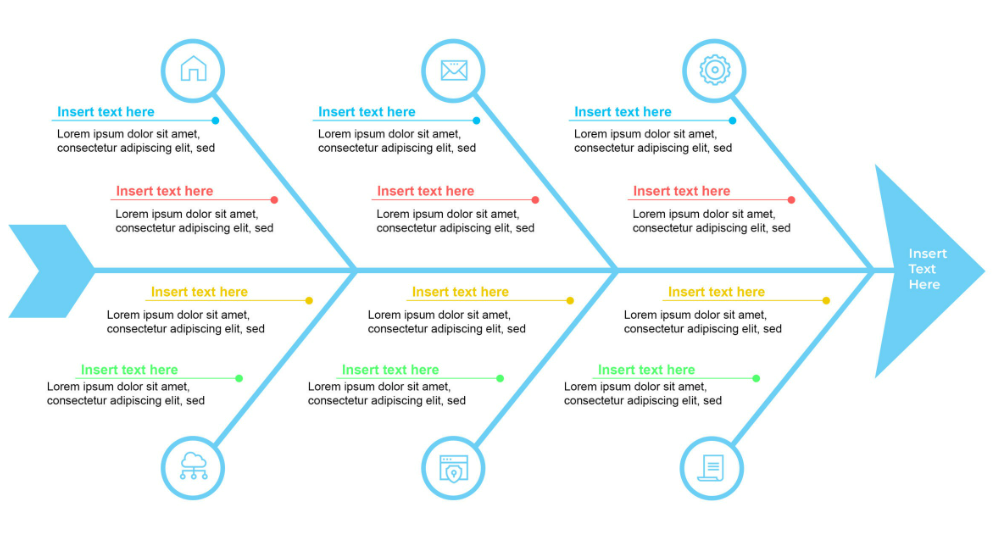
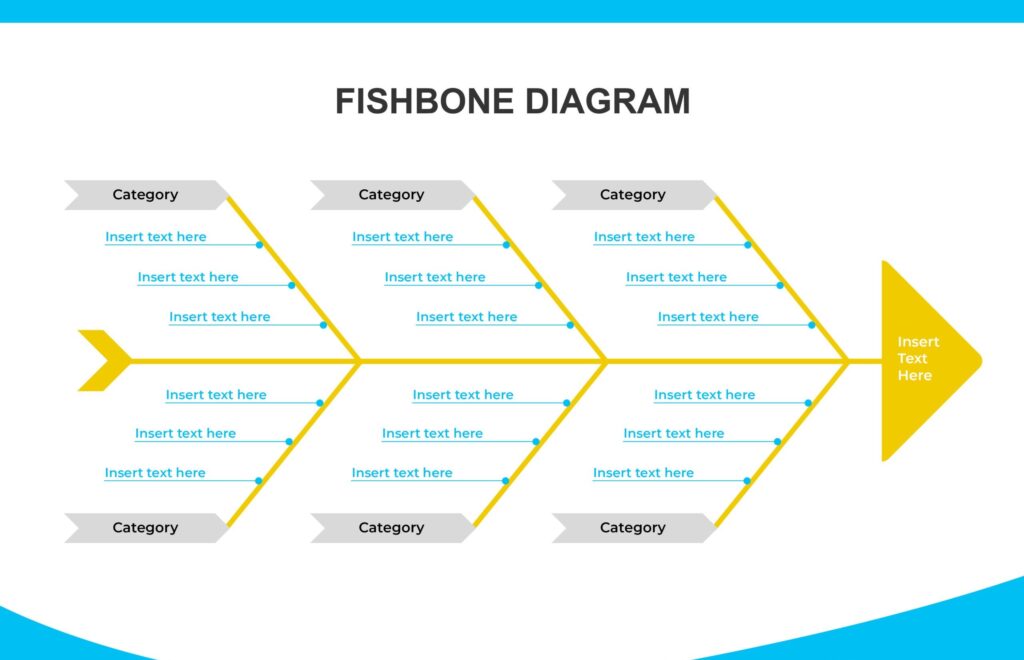
A fishbone diagram template is important graphical tool because it helps to identify and analyze the possible causes of a specific problem or effect. The diagram gets its name from its shape, which resembles the skeleton of a fish, with the problem or effect represented as the “fish head”. The potential causes represented as “bones” branching off from the main spine.
The fishbone diagram template also known as a cause and effect diagram or Ishikawa diagram, is using to visually organize and categorize potential causes into major categories. It helps teams or individuals brainstorm and identify all possible causes that could contribute to a problem or effect.
The fishbone template allows users to add more specific sub-causes or factors under each major category. These sub-causes are represented as smaller lines branching off from the main bones. This hierarchical structure helps visualize the relationships between the causes and their respective categories.
Therefore the fishbone diagram template, teams can systematically explore and identify potential causes, facilitating a more comprehensive understanding of the problem or effect at hand. Also it can aid in problem-solving, decision-making, and generating ideas for potential solutions or corrective actions.
Is there a fishbone diagram in Word?
Microsoft Word, like Google Docs, provides features that allow you to create a diagram template. Although there may not be a pre-designed fishbone Word template specifically labeled as such in Word, but you can easily create one using the drawing tools available in the software.
How do I create my own fishbone diagram?
Firstly, to make a fishbone diagram in Microsoft Word, open it and start a new blank document. On the Ribbon at the top, click on the “Insert” tab. In the “Illustrations” group, click on the “Shapes” button. A dropdown menu will appear with various shape options.
Scroll down to the “Lines” section of the Shapes menu and choose the shape that resembles a line or arrow (e.g., “Line,” “Curved Arrow,” or “Block Arrow”). Click and drag on the document to draw a horizontal line across the page. This line will serve as the backbone or spine of the fishbone diagram.
To create the angled head of the fish, just draw a smaller line branching off at the end of the horizontal line, angling upward. Draw diagonal lines branching off from the spine to represent the major categories or “bones” of the fishbone diagram. Also you can use the same line shape as in step 4 and rotate it as needed. Label each category along the diagonal lines using text boxes or Word’s text tool.
Add subcategories
Under each major category, add smaller diagonal lines or branches to represent the sub-causes or factors related to each category. You can use shorter lines or arrows for the sub-branches. Add text labels to describe each cause. Continue adding sub-causes and labels until you have included all relevant factors related to the problem or effect being analyzed.
Finally, customize the appearance of the diagram by adjusting the line colors, thickness, or adding fill colors to the shapes. You can right-click on a shape or line, select “Format Shape,” and explore the available formatting options. Add any additional text or descriptions as needed to provide context or explanations for the diagram and save the document for future use or printing.
By following these steps, you can create diagram in Microsoft Word using the available drawing tools and features or download free fishbone diagram template in Word.
How do I convert text to diagram in Word?
If you don’t have this template, don’t worry, you can easily create one yourself. Open Microsoft Word and start a new blank document or open an existing document. Select the text you want to convert into a fishbone diagram. This text should include the main problem or effect and the potential causes that you want to represent in the fishbone template.
So, on the Ribbon at the top, click on the “Insert” tab. In the “Illustrations” group, click on the “SmartArt” button. A gallery of SmartArt graphics will appear. In the left pane of the SmartArt dialog box, select the “Hierarchy” category.
Choose the SmartArt graphic called “Horizontal Organization Chart” or “Picture Organization Chart.” These options provide a structure that can be modified to resemble a fishbone diagram. Click on the chosen SmartArt graphic and click the “OK” button. The graphic will be inserted into your document, and a text pane will appear on the left side of the screen.
In the text pane, replace the placeholder text with your own content. Enter the main problem or effect in the top-level text box, and enter the potential causes in the subsequent text boxes.
Customization with SmartArt Tools
Customize the appearance of the diagram using the options in the “SmartArt Tools” tab that appears when you have a SmartArt graphic selected. You can change the colors, layout, style, and other formatting options to resemble a fishbone diagram.
Add any additional text, labels, or categories to the diagram using the text boxes provided. By using the SmartArt feature in Word and selecting a suitable hierarchy-based SmartArt graphic, you can create a fishbone diagram. Customize the appearance and structure of the SmartArt graphic to resemble the fishbone diagram format, and enter your own content to represent the problem or effect and its potential causes.
Downloads:
Manufacturing Fishbone Diagram
Sales Process Fishbone Diagram
Ishikawa Diagram for Presentations